
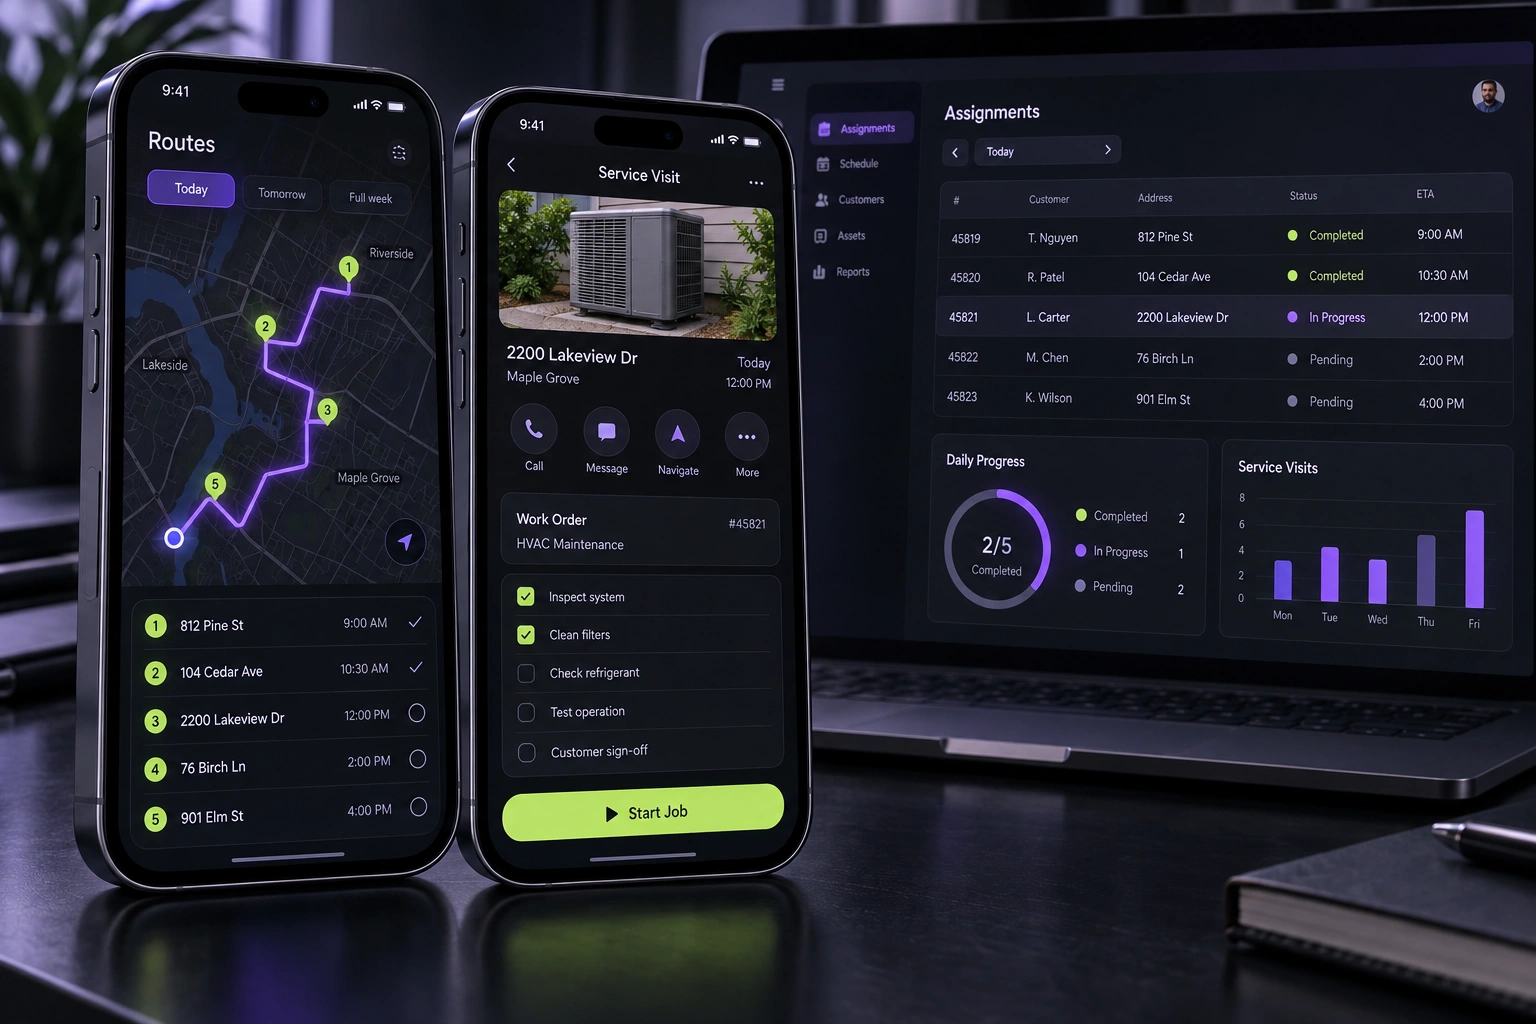
Measure the path from discovery to a successful user outcome, then connect retention, reliability and support evidence to a small set of weekly decisions. Downloads alone cannot show whether the app is useful, dependable or ready for wider investment.
Put this guidance into practice
Explore our custom CRM and ERP development, software development, application launch, premium website development and business automation services. We scope the work around your existing tools, team and goals.
Begin with the decision each metric should support
A launch dashboard should not be a collection of every number the tools can produce. Start with the decisions the team expects to make during the first month: whether onboarding needs repair, whether a core workflow is understandable, whether a release is stable, whether one acquisition source brings better-fit users, or whether the product is ready for a wider rollout.
For each decision, name one primary signal, the segment and time window, the person responsible and the action that follows. This prevents a team from celebrating surface-level activity while users fail to reach the outcome the product was built to deliver.
Record the measurement definition before launch. Apple and Google can define users, devices, sessions, acquisitions and retention differently, so compare like with like and keep platform reports separate until the definitions are reconciled.
- Decision the metric will inform
- Definition, source and reporting window
- Relevant user, device, version or acquisition segment
- Named owner and review cadence
- Action threshold or investigation trigger
Separate discovery, installation and activation
Acquisition is a sequence. A person can see a store listing, visit it, install the app and still never complete the first valuable action. Review the conversion between those stages instead of treating an install as a successful customer outcome.
Google Play's acquisition reporting distinguishes store-listing visitors, first-time installers and retained installers, and it can break results down by channel or country. App Store Connect similarly brings discovery, download and engagement measures together. Use these platform reports to diagnose the store journey, then use product events to understand what happens after the app opens.
Define activation as an observable result that matters to the user: completing a first booking, submitting a field report, creating a project, inviting a teammate or finishing another core journey. Avoid a definition based only on account creation when the account itself delivers no value.
- Store-listing views and visit-to-install conversion
- First open and onboarding completion
- Completion of the first valuable journey
- Time from first open to that outcome
- Drop-off point and reason where it can be observed responsibly
Measure the core outcome, not every tap
Instrument the few events that describe the product's operating story. Firebase Analytics supports recommended and custom events, but the availability of many event types is not a reason to collect them all. Use consistent names, meaningful parameters and a documented event dictionary so the team can interpret the data later.
Measure both success and important failure states. If the product helps a user request a service, capture the completed request and the validation, payment or availability failures that prevent it. For a business application, include the staff-side event that fulfils or reviews the request; a customer click is not a completed business outcome when the operational handoff fails.
Test the analytics implementation before relying on it. Compare a controlled test journey with the recorded events, exclude internal testing where appropriate and confirm that consent, privacy and data-minimisation requirements are reflected in the design.
- One event for the start and completion of the core journey
- Reason-coded validation and processing failures
- Operational completion or staff acknowledgement
- Duration or steps where they indicate friction
- Event-quality check against a controlled test journey
Use retention to test continuing value
Retention asks whether people return after the first experience, but the right interval depends on the product. A daily operations app and a quarterly compliance tool should not be judged by the same usage rhythm. Define the natural repeat event and the period in which it should happen.
Google Play reports retained installers over intervals including seven and thirty days, while App Store Connect exposes retention measures including day 1, 7, 14 and 28 where data is available. Segment retention by acquisition source, app version and relevant user group before drawing a conclusion; an overall average can hide a strong cohort and a broken one.
Pair retention with qualitative evidence. A user may return because the product is useful, because a process forces them to, or because the previous attempt failed. Support conversations and short interviews help explain the pattern behind the number.
- Return to the core journey at a product-appropriate interval
- Day or week cohort retention by app version
- Retention by acquisition source or target segment
- Deletion, abandonment or inactivity signals where available
- Interview and support evidence explaining the observed behaviour
Treat stability and performance as product metrics
A product cannot learn from users who cannot complete the journey. Review crash-free users or sessions, Android user-perceived crashes and application-not-responding events, slow or failed network operations, and the device or operating-system combinations associated with regressions.
Android vitals identifies user-perceived crash rate and ANR rate as core quality signals that can affect visibility on Google Play. App Store Connect can segment crashes by app version, device and platform version. Firebase Crashlytics adds issue grouping, prevalence, release filtering and alerts that help a team move from a percentage to an actionable defect.
Set a release-response routine before launch: who receives an alert, how severity is judged, what evidence is required, how a fix is tested and when rollback or staged release controls are used. A stable aggregate can still conceal a serious problem on one high-value device or workflow.
- Crash-free users and sessions by release
- User-perceived crashes and ANRs
- Affected device, operating-system and app-version segments
- Failed or unusually slow core operations
- Time from detection to mitigation and verified recovery
Run a weekly evidence review, not a vanity dashboard
Use the first month as four decision cycles. Review acquisition and activation, core-outcome completion, retention, reliability and support themes together. Write down what changed, what the evidence suggests, the decision made and the next test. This creates an operating memory instead of a sequence of disconnected dashboard screenshots.
Keep the sample size and data availability visible. Apple notes that some analytics can be limited by user opt-in and privacy thresholds; young products can also produce volatile percentages from small cohorts. Treat early signals as evidence to investigate, not as certainty or a promise of product-market fit.
DigiStartup India helps founders define the measurement plan alongside product scope, analytics events, launch readiness, operational ownership and early iteration. The useful output is not a larger dashboard; it is a shorter path from real user evidence to the next responsible product decision.
- Weekly snapshot with definitions and cohort sizes
- Top successful outcome and top failure pattern
- Reliability issues and release actions
- Support themes and qualitative evidence
- One prioritised decision and its next measurement window
Further reading
Frequently asked questions
What is the most important metric after launching an app?+
Start with completion of the app's first valuable user outcome. Review acquisition, activation, retention and reliability around that outcome so the team can tell whether people reach it, return for it and experience it dependably.
Are downloads enough to judge an app launch?+
No. Downloads describe acquisition, not successful use. Combine store conversion with first-open activation, core-journey completion, retention, crash and failure data, and support evidence.
How often should launch metrics be reviewed?+
Operational stability alerts should be monitored continuously, while a focused cross-functional review once a week is usually practical during the first month. Keep definitions and cohorts consistent so changes can be interpreted responsibly.
Should every user action be tracked?+
No. Track the minimum events needed to understand the core journey, important failures and agreed decisions. Excessive event collection increases implementation, privacy and interpretation risk without necessarily improving the product.